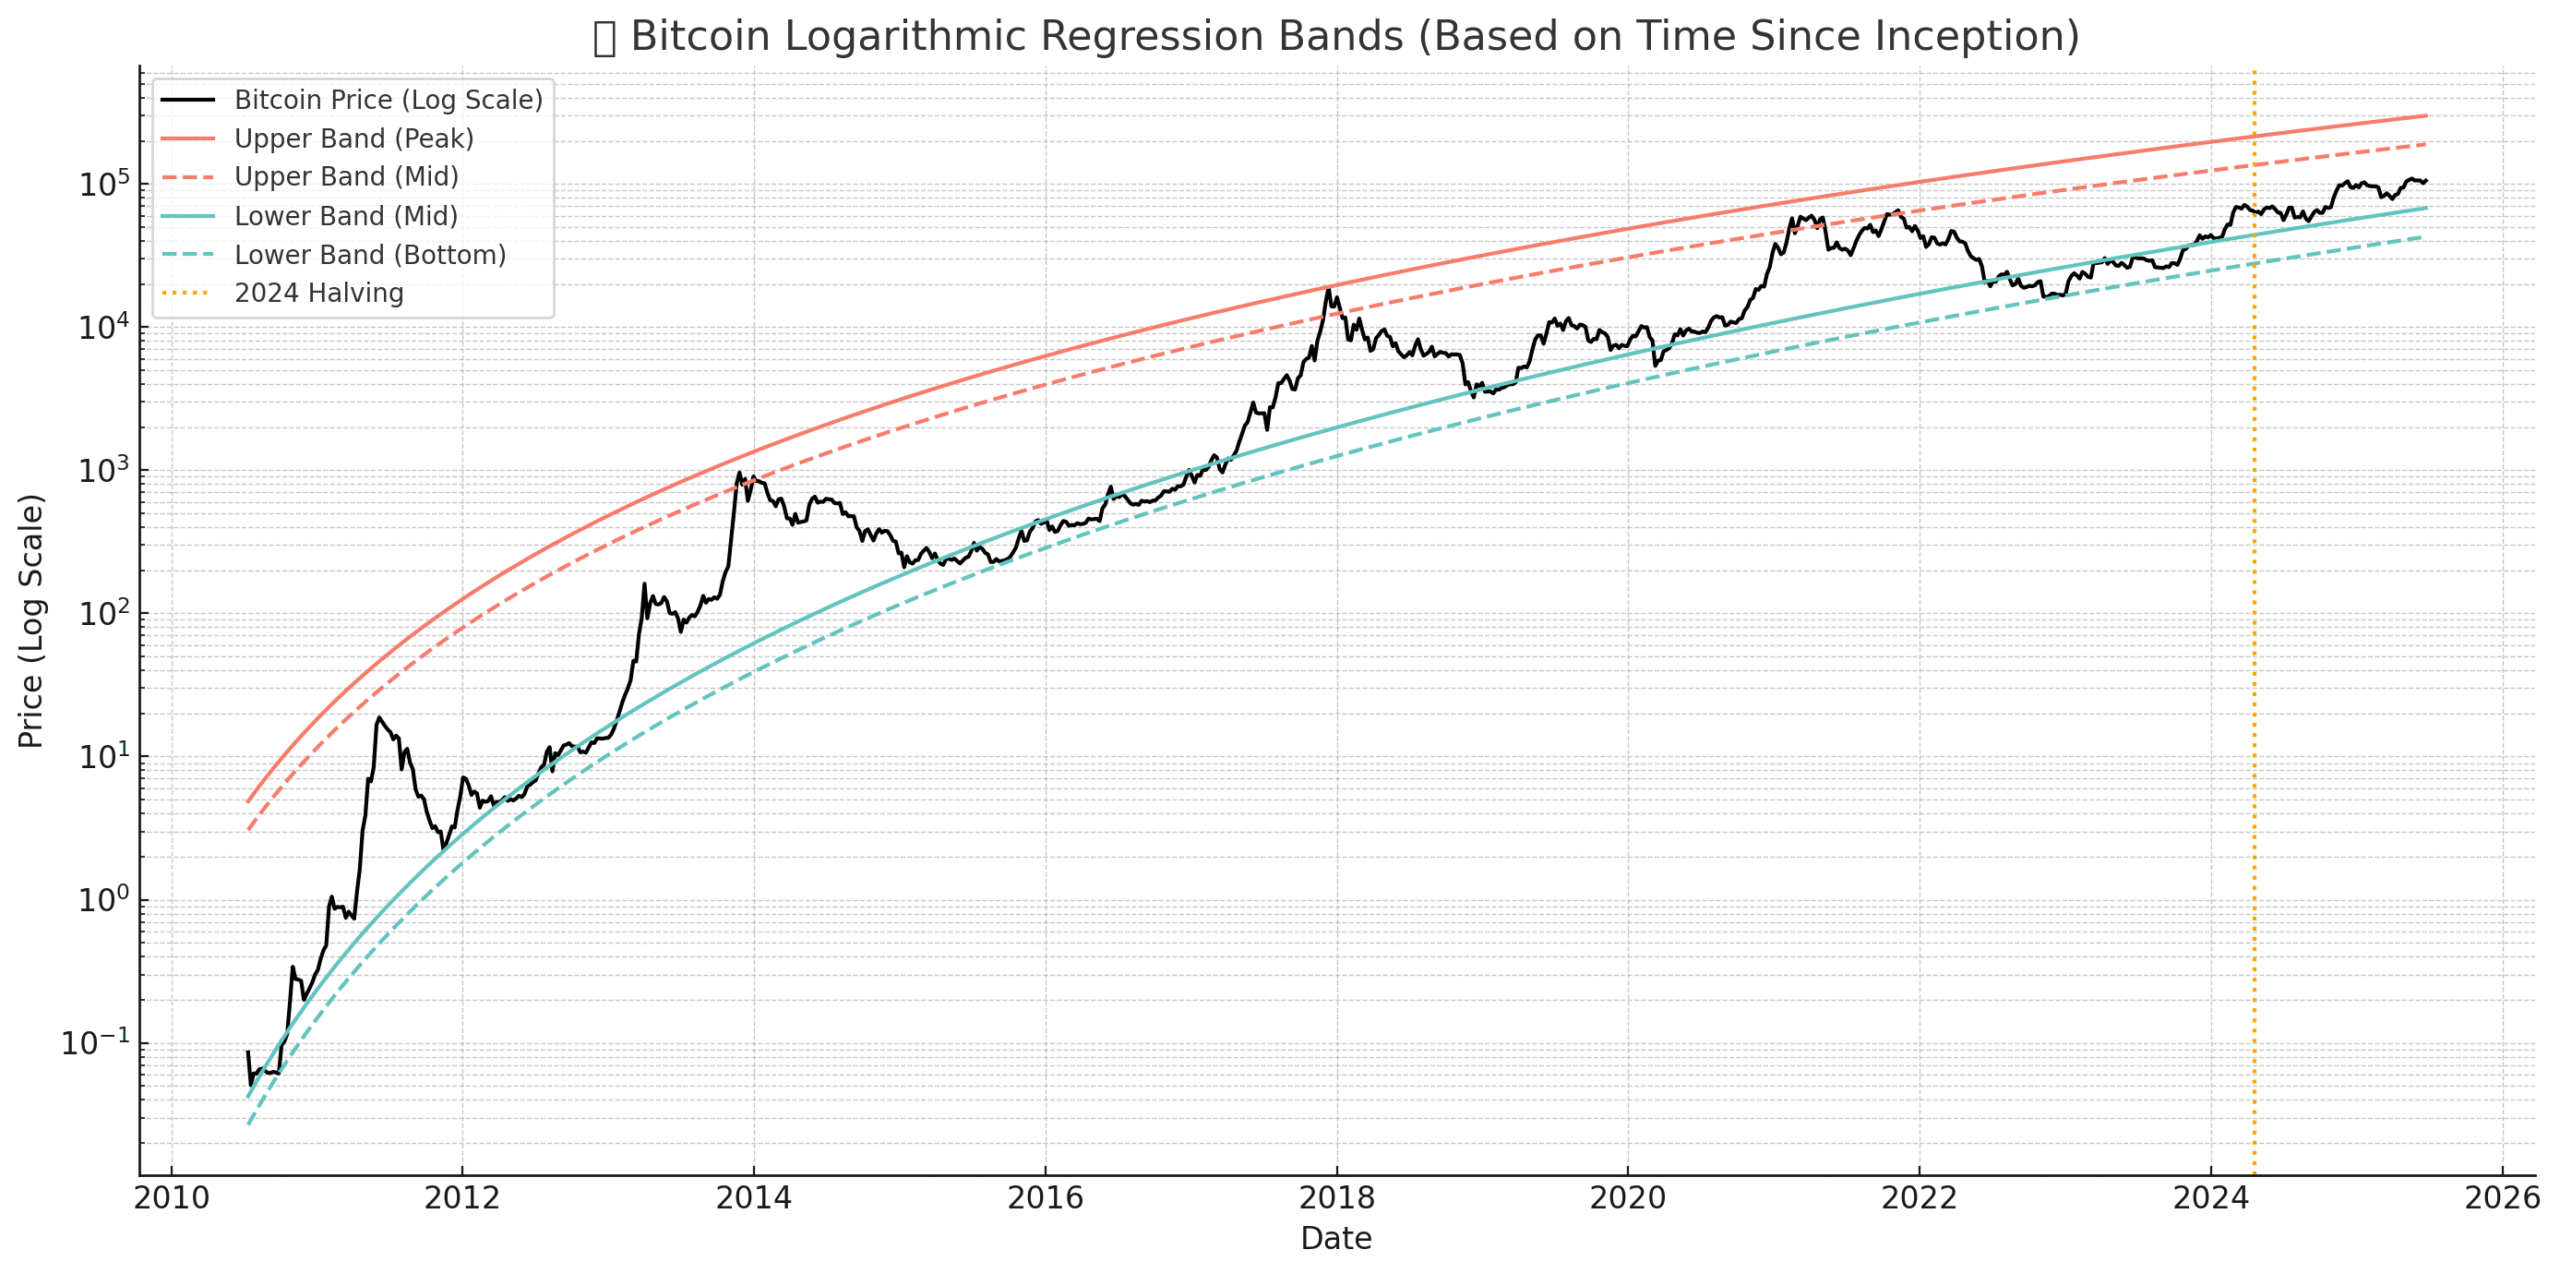
This chart shows Bitcoin's historical price overlaid with long-term regression bands that have predicted every major top and bottom since 2011.
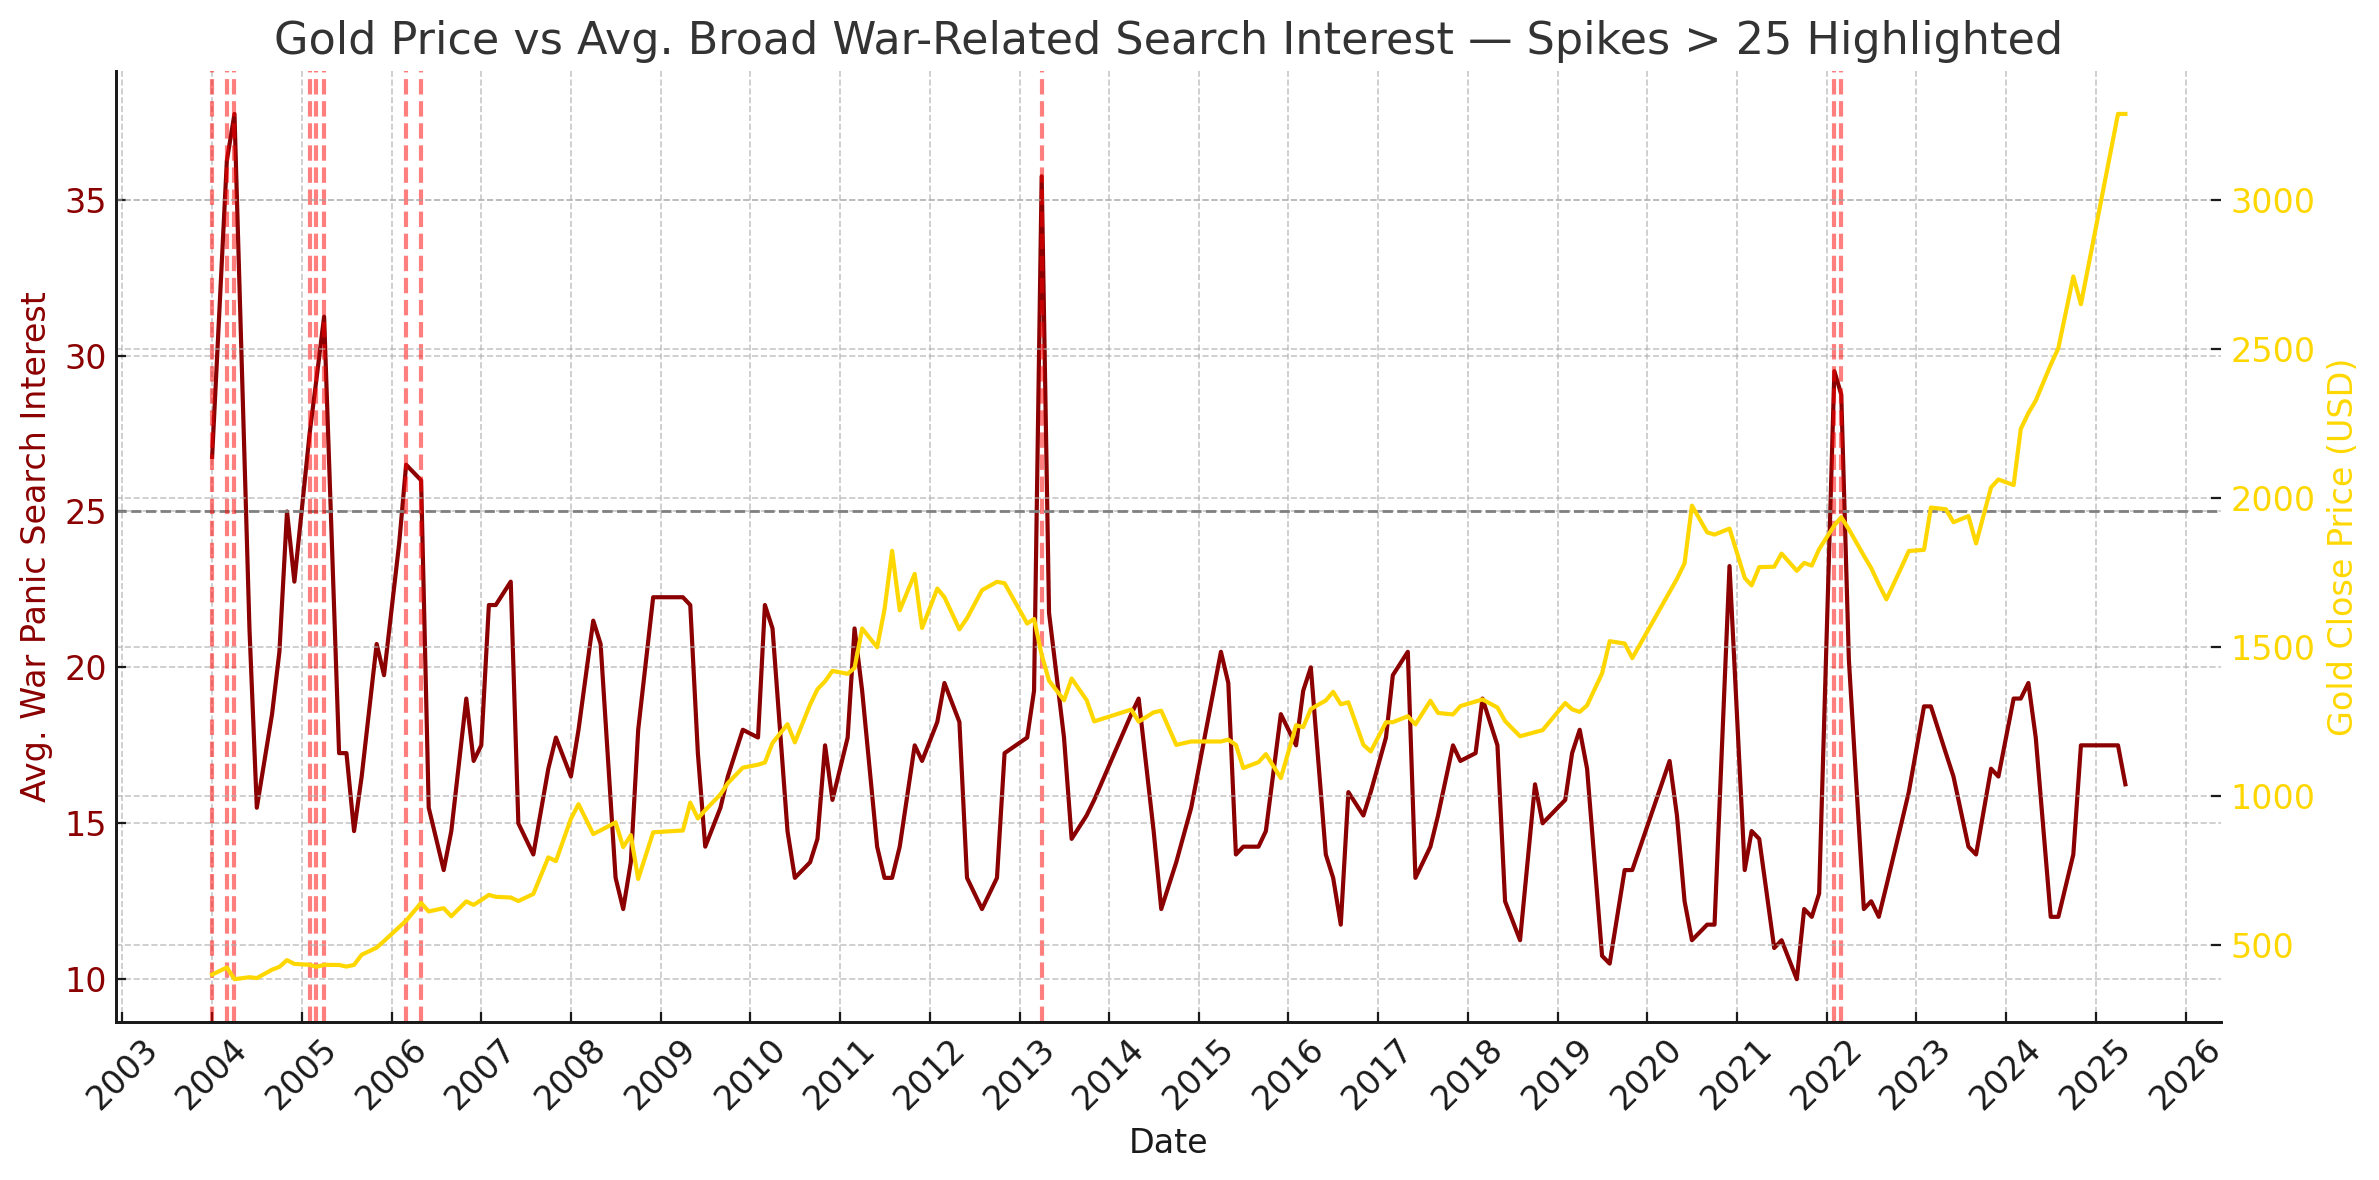
This chart tracks the price of gold against the average search interest in these terms:
“nuke,” “world war,” “World War III,” “bomb,” and “invasion” (all U.S.-based Google Trends).
Every red vertical line highlights a month when the combined average search interest spiked above 25, revealing moments of heightened fear and gold’s corresponding movement as a safe-haven asset.
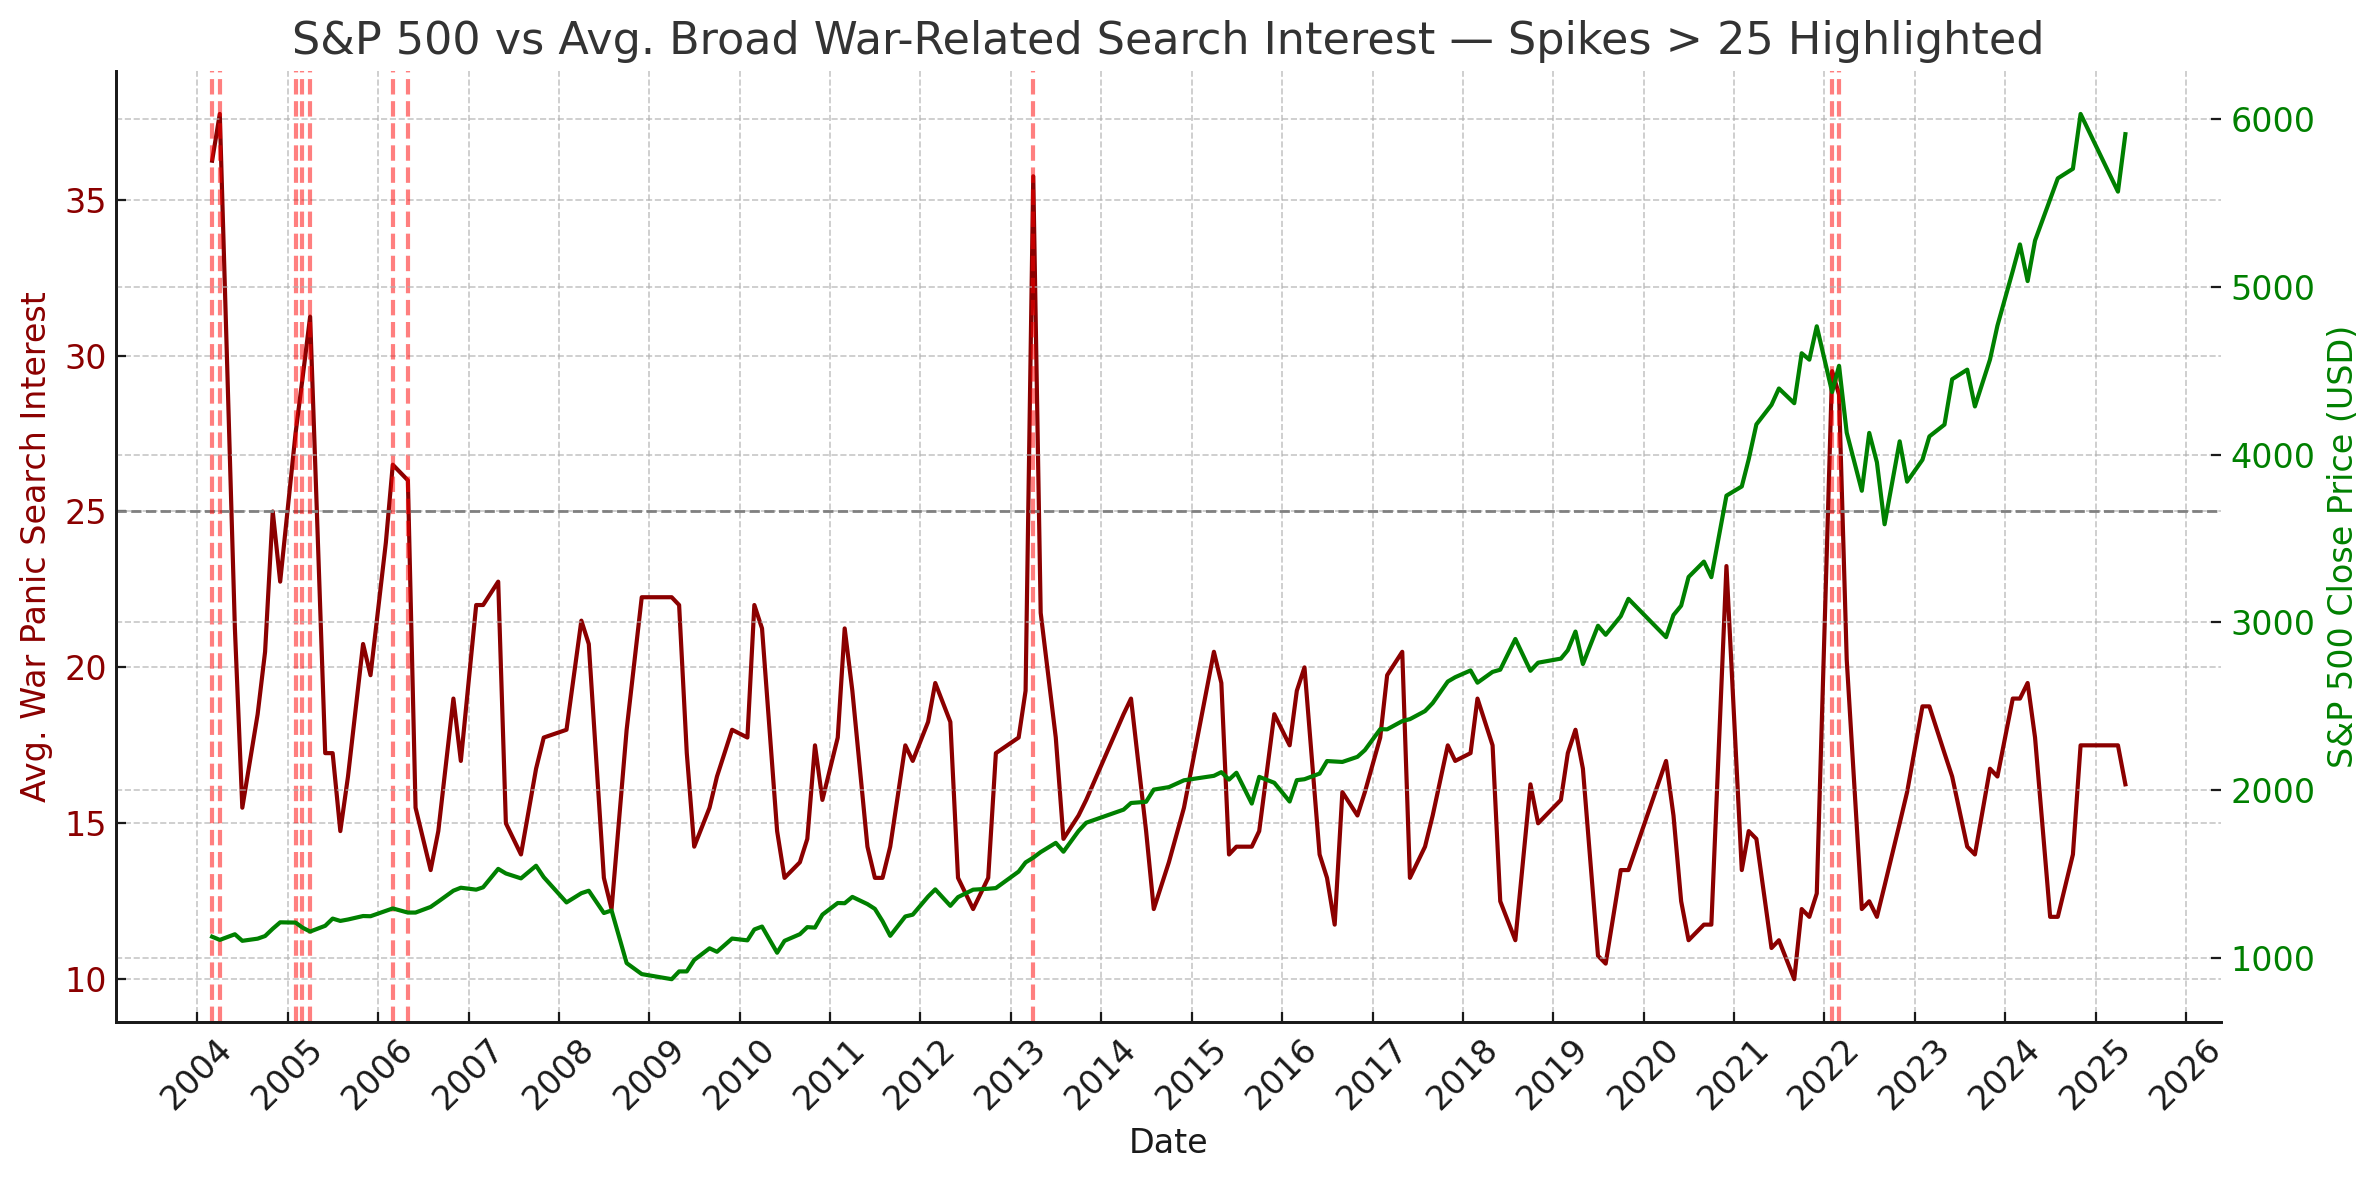
Here, the S&P 500 index is plotted against the combined U.S. search activity for:
“nuke,” “world war,” “World War III,” “bomb,” and “invasion.”
Spikes in red indicate months where the public’s fear breached a search interest average of 25, offering a clear view of how equity markets respond to geopolitical stress signals.
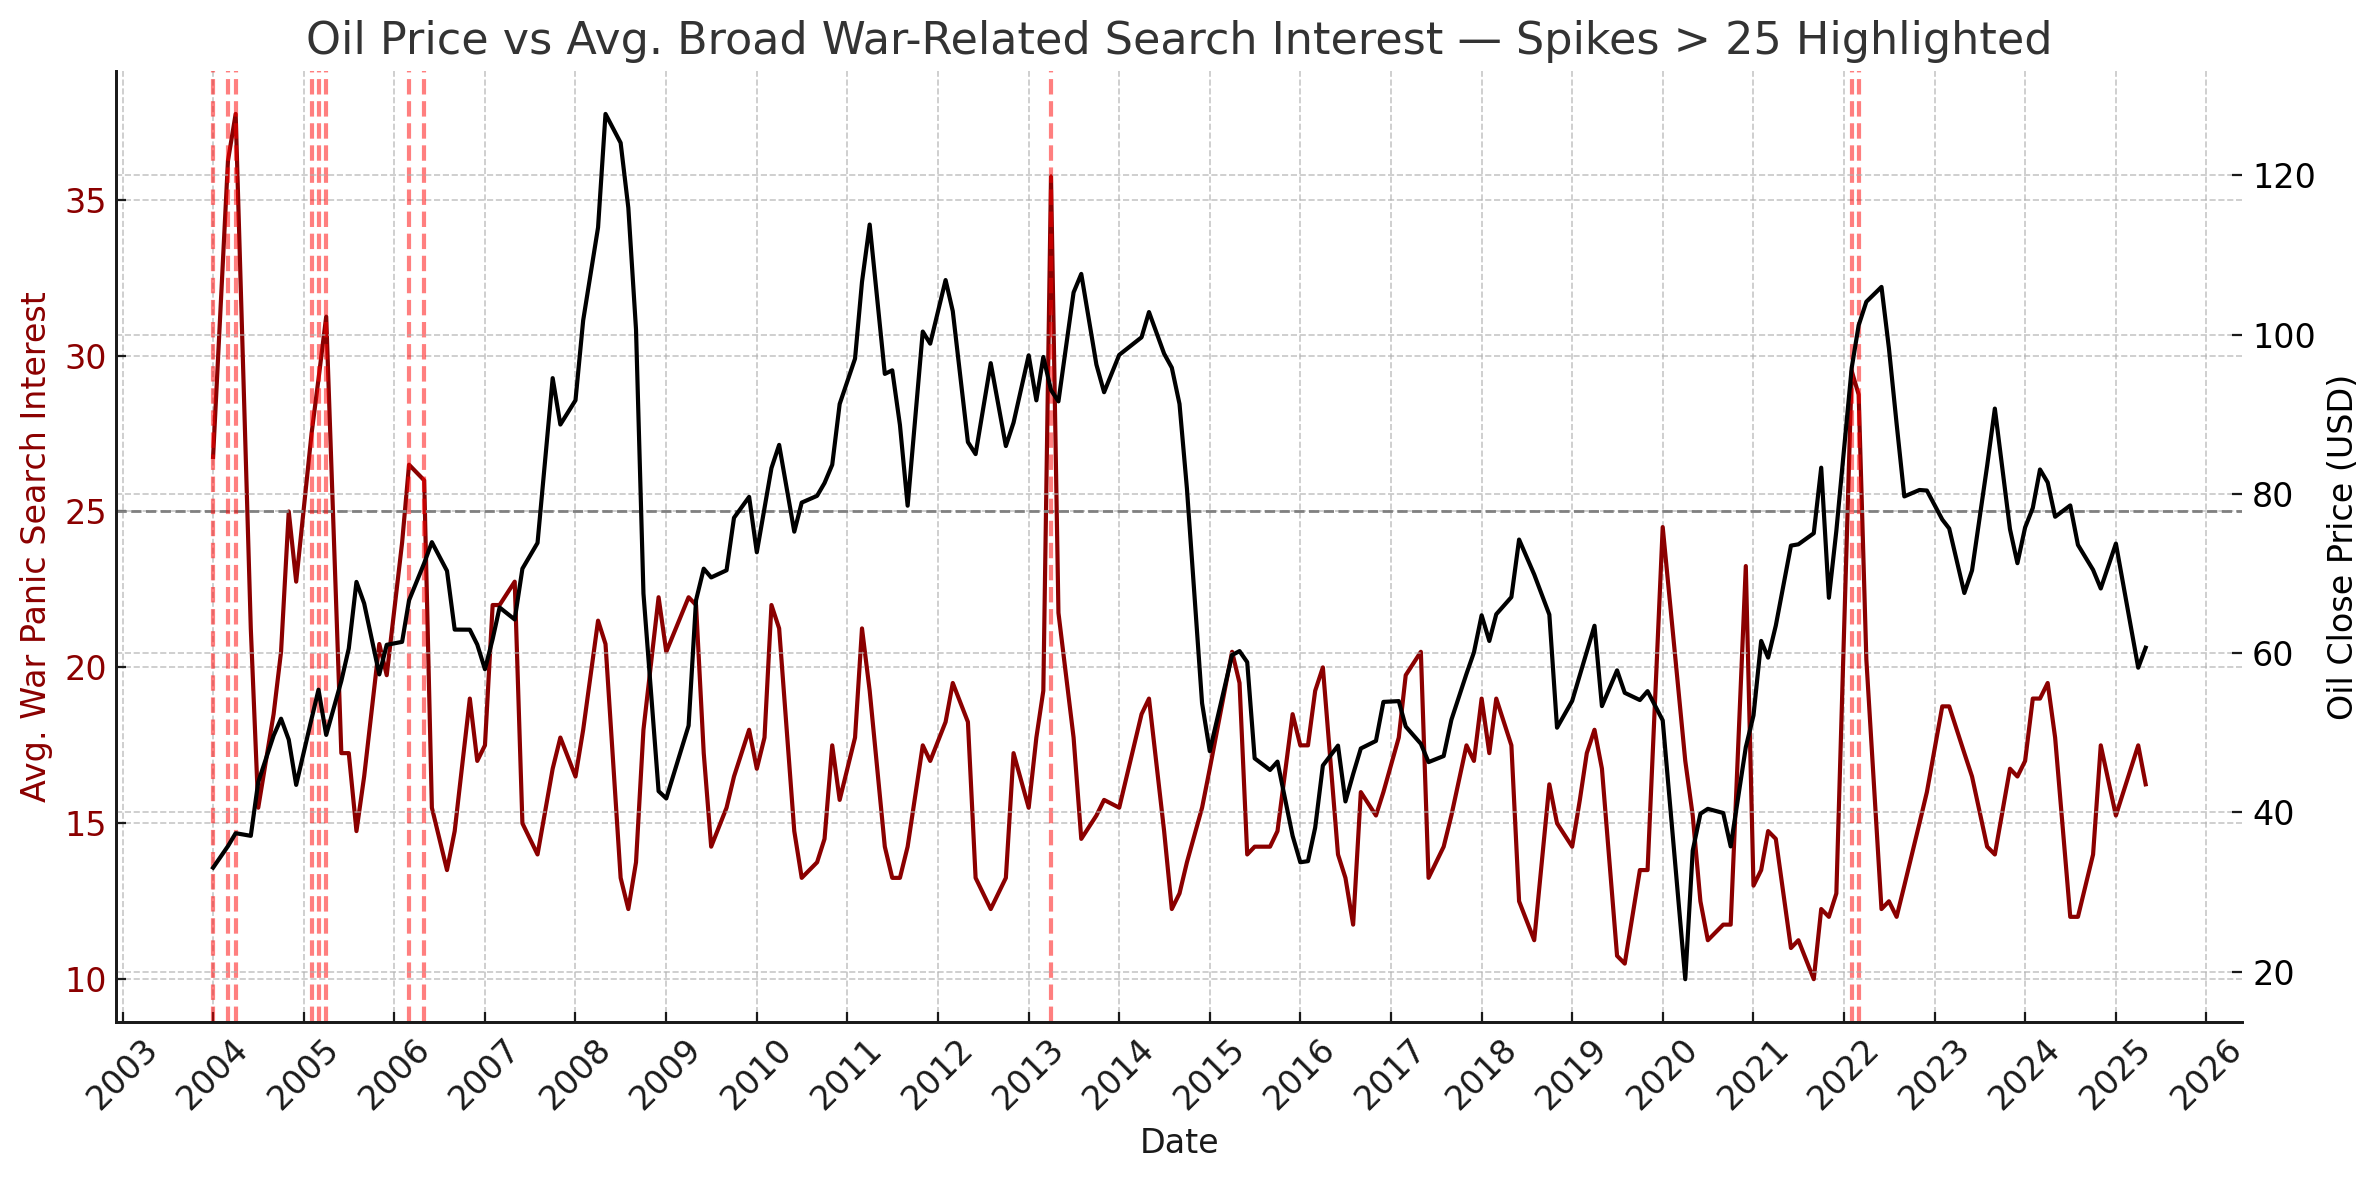
This visual compares oil price action with the public’s combined search intensity for:
“nuke,” “world war,” “World War III,” “bomb,” and “invasion.”
When average search interest exceeded 25 (highlighted in red), oil markets often experienced significant moves, revealing the link between conflict fears and energy volatility.
